Create performance chart using Windows performance monitoring
tool
1)
Open performance monitor tool in windows 2008/
windows 7
2)
Right click on the existing chart and click
properties

3)
Click source tab and add log file (captured csv
file) and click ok and after that you might not see anything on the chart. Need
to add the counters


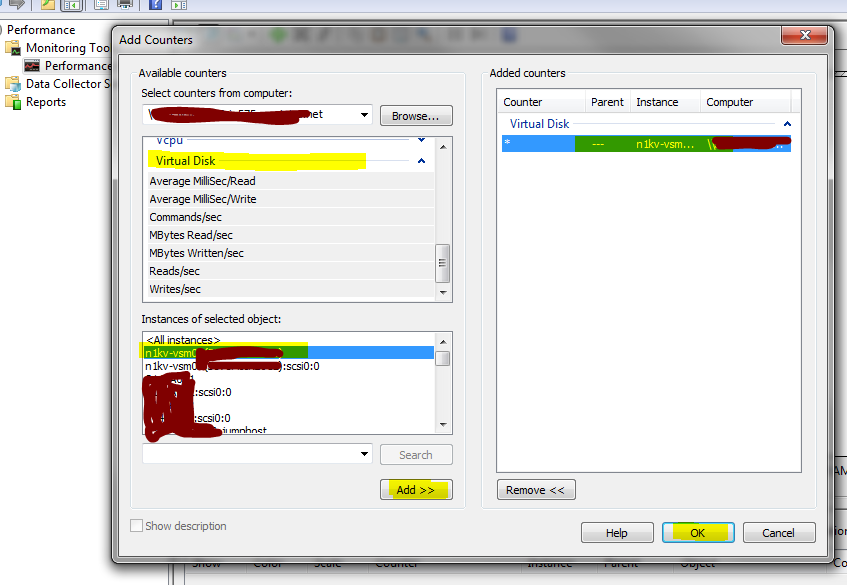
4)
then you can add your required object and
counters and click OK ( below example I have choose n1kv VM
5)
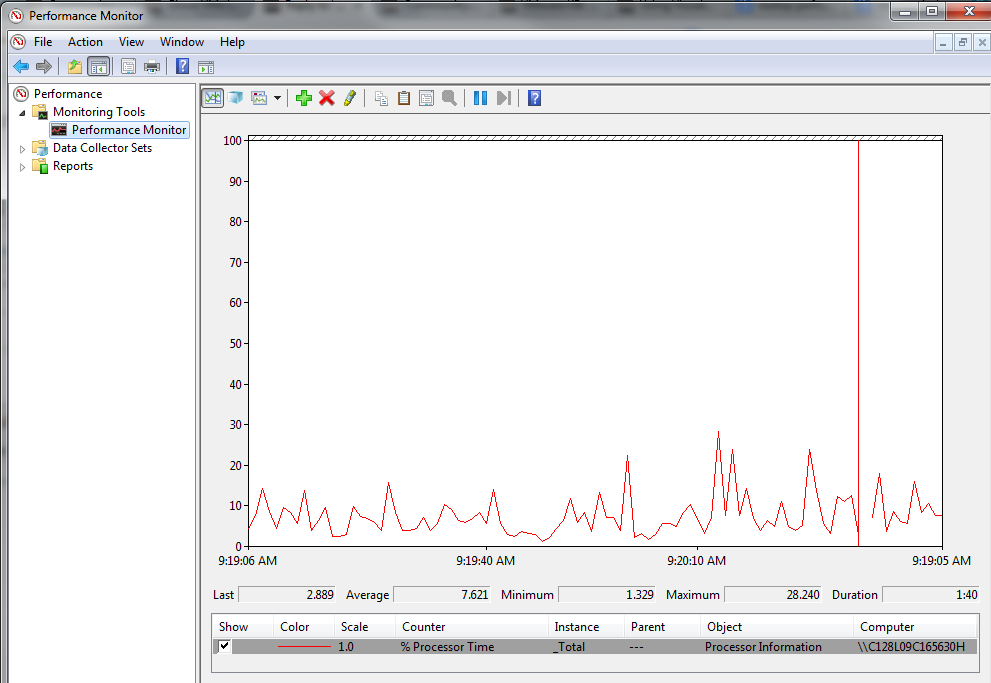
Finally you may able to see all of your required
data charts. ( since I have chosen 1kv VM as example, there is no much load on
the vm)

No comments:
Post a Comment